

Top 5 Technical Indicators Every Crypto Trading Bot Should Use
Introduction
In automated crypto trading, the efficiency of your strategy depends heavily on the technical indicators your bot uses. These indicators constitute the core of your decision-making logic, as they define when to buy, when to sell, and under what conditions.
A technical indicator is a mathematical formula that analyzes historical and real-time market data such as price, volume, or volatility. Unlike fundamental analysis, indicators don’t look at news or macroeconomics, they focus strictly on price behavior to generate actionable signals.
For example:
- RSI measures whether a token is overbought or oversold.
- EMA tracks the direction and strength of a trend.
- Bollinger Bands show volatility and help detect when a price deviates too far from its average.
With crypto trading bots, indicators act as signal triggers. They’re used in formulas and logic blocks that tell a bot exactly what to do and when.
In this article, we’ll cover the 5 best crypto trading bot indicators. We’ve chosen them for their reliability, speed, and compatibility with Origami Tech, a no-code crypto trading bot platform used for building and managing automated strategies across spot and futures markets.
Criteria for Choosing Crypto Trading Bot Indicators
Before diving into specific indicators, it’s important to understand what makes an indicator “bot-worthy.” Here are the three key criteria:
1. Signal Reliability
The best crypto trading bot indicators should help your bot make smart decisions, not random guesses. Signal reliability refers to how often the indicator gives you a correct buy or sell signal. If it frequently tells the bot to trade during minor price fluctuations (“noise”) rather than during real trends, it creates false positives, or trades that lose money.
Reliable indicators filter out this noise. They only act when the market shows strong signs of movement. For example, instead of reacting to every price dip, a reliable RSI setup waits for a truly oversold signal before buying. This helps your bot avoid chasing meaningless price moves and reduces losses from unnecessary trades.
2. Computational Efficiency
Crypto bots run non-stop — analyzing markets, updating strategies, and placing orders 24/7. To be useful, your crypto trading bot indicators must be lightweight and fast. If a formula takes too long to calculate, especially in volatile markets, it could result in delayed decisions and missed opportunities.
3. Compatibility with Software
Origami Tech eliminates this concern by offering a robust library of built-in indicators, including RSI, EMA/SMA, Bollinger Bands, and many others commonly used in technical analysis. These indicators can be applied through an intuitive visual interface using simple formulas, variables, and conditional logic, without any programming. The platform supports seamless use of these tools across both spot and futures trading strategies, allowing users to build and customize sophisticated bots with ease.
4. Trading Use Cases
Not all indicators are designed for the same purpose. Some work better in trending markets, while others are best for sideways or volatile conditions. Choose indicators that match the type of trading you’re automating:
- Spot bots benefit from momentum and reversal indicators like RSI and Bollinger Bands, which help identify short-term price extremes.
- Futures bots often rely on trend-following tools like EMA, along with volatility triggers, to manage leverage and margin.
- Swing strategies (medium-term trades) usually combine multiple indicators. For example, they can employ EMA to define trend direction and RSI or the Stochastic Oscillator to time entries, helping confirm signals before executing a trade.
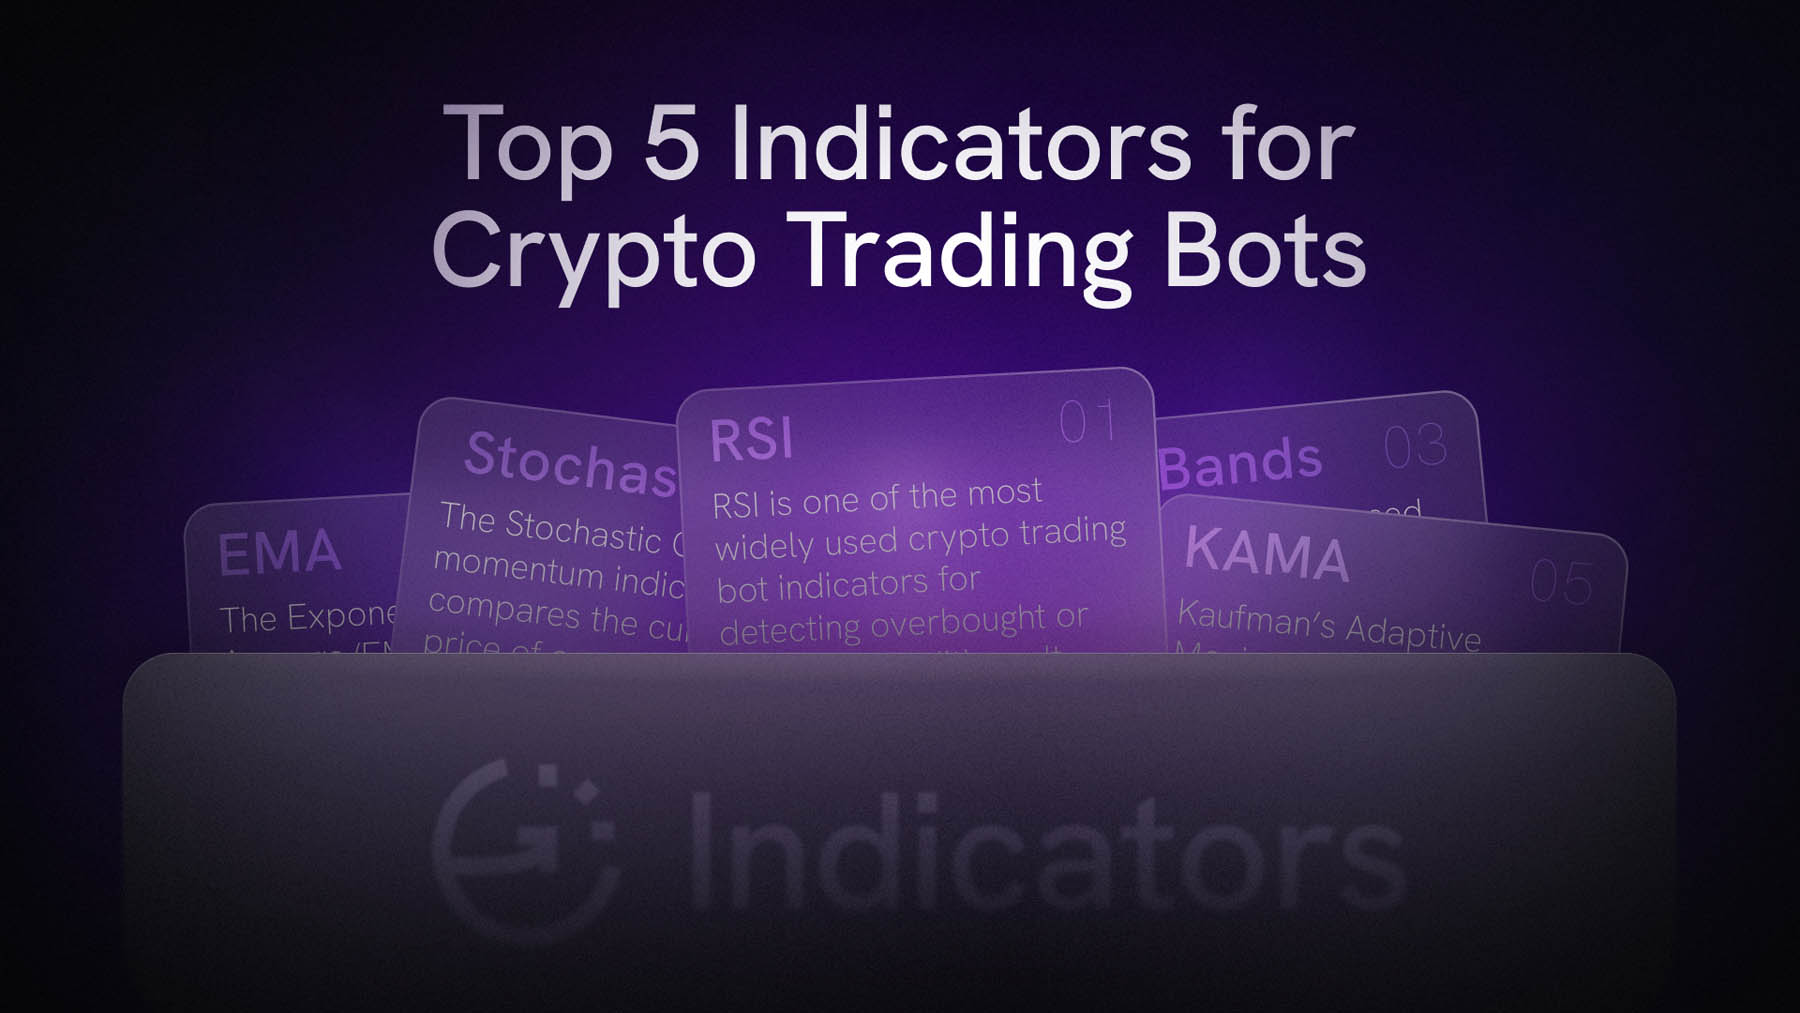
Top 5 Technical Indicators for Trading Bots
1. Relative Strength Index (RSI)
RSI is one of the most widely used crypto trading bot indicators for detecting overbought or oversold conditions. It measures market momentum by analyzing recent price changes, outputting a value from 0 to 100.
- Typical Use: Buy when RSI < 30 (oversold), sell when RSI > 70 (overbought).
- Origami Tech Deployment: Use rsi_to_price() in the grid formula to calculate entry prices directly based on RSI signals.
Sample Grid in Origami Tech:
execute_price = rsi_to_price(candles('m15', 'BTC-USDT', 'binance'), 30)
execute_volume = balance('counter').available * 0.05 / execute_price
buy_orders_count = 1
sell_orders_count = 0
This setup tells your crypto trading bot to buy BTC/USDT when the 15-minute RSI drops below 30, a powerful reversal signal in volatile markets.
Backtest Insights:
- Best for: Range-bound or mean-reverting markets.
- Warning: Avoid during strong trends, where RSI can remain in overbought/oversold zones for extended periods of time.
2. Exponential Moving Average (EMA)
The Exponential Moving Average (EMA) is a core trend-following indicator used in crypto bot trading. It smooths out price movements and gives more weight to recent data, allowing bots to detect market direction with minimal delay.
With Origami Tech, EMA is implemented through a built-in function that works directly with candle data:
ema(candles: List[[Candle]], period: int = 14, column: str = "close") -> List[Decimal]
This function calculates a series of EMA values over any timeframe using the selected candle source (e.g., 1m, 5m, 15m) and the specified price type, which is typically the closing price. The default period is 14, but you can adjust it to fit your strategy.
EMA is often used in bots to:
- confirm trend direction before entering a trade;
- avoid signals that go against market momentum;
- support logic for entries, exits, or position scaling.
3. Bollinger Bands
Bollinger Bands are used in crypto bot trading to detect periods of high and low volatility, as well as potential overbought or oversold conditions. The indicator consists of three lines: a central moving average and two bands, upper and lower, placed at a distance defined by standard deviation.
In Origami Tech, Bollinger Bands are calculated with the following function:
bbands(candles: List[[Candle]], period: int = 20, multiplier: float = 2, column: str = "close") -> List[BBANDS]
This function returns a list of objects containing .upper, .middle, and .lower values based on the selected period and volatility settings. The bands dynamically adjust: they expand when volatility rises and contract when the market is calm.
Crypto trading bots in Origami Tech often use Bollinger Bands to:
- Detect volatility squeezes that may lead to breakouts;
- Identify oversold conditions near the lower band and overbought conditions near the upper band;
- Filter entries or exits during sideways markets.
Bollinger Bands are especially effective in mean-reversion strategies or when paired with momentum indicators like RSI. In Origami Tech’s no-code environment, you can directly use Bollinger values in your formulas without having to write any backend logic.
4. Stochastic Oscillator %K
The Stochastic Oscillator is a momentum indicator that compares the current closing price of an asset to its price range over a defined period. It helps crypto trading bots identify whether the market is in an overbought or oversold condition, making it especially useful for short-term reversal strategies.
In Origami Tech, the %K line of the Stochastic Oscillator is calculated using the following function:
stoch(candles: List[[Candle]], period: int = 14) -> List[Decimal]
Parameters:
- candles: list of historical candle data
- period: number of candles used to calculate the high-low range (default: 14)
Returns:
A list of %K values, the core of the stochastic calculation, showing the current close's position relative to the recent high-low range.
Traders typically interpret:
- Values above 80 as overbought (possible sell zones),
- Values below 20 as oversold (possible buy zones).
On Origami Tech, this function can be used inside grid formulas to build responsive entry logic or filter trades during sideways conditions. Stochastic %K is especially effective when paired with trend filters like EMA or Bollinger Bands.
5. Kaufman’s Adaptive Moving Average (KAMA)
Kaufman’s Adaptive Moving Average (KAMA) is a dynamic trend indicator that adjusts its sensitivity based on market volatility. Unlike standard moving averages, KAMA becomes smoother in sideways markets and reacts faster during strong trends, making it especially effective for crypto trading bots that need to filter out noise while staying responsive.
In Origami Tech, KAMA is calculated with the following function:
kama(candles: List[[Candle]], er: int = 10, fast: int = 2, slow: int = 30, period: int = 20, column: str = "close") -> List[Decimal]
Parameters:
- er: efficiency ratio period (default: 10)
- fast: fast EMA constant (default: 2)
- slow: slow EMA constant (default: 30)
- period: length of the smoothing window (default: 20)
- column: price type used for calculation (default: "close")
KAMA can be used in Origami Tech grid formulas to confirm trend strength, filter out weak signals, or adjust position logic dynamically based on market conditions. It’s especially useful in mixed strategies where the market shifts between consolidation and breakout phases.
Combining Indicators into Robust Strategies
The real power of automation lies in multi-indicator strategies. With Origami Tech’s visual grid system, you can stack multiple conditions to make your crypto trading bot smarter and more selective.
Example: RSI + EMA Trend Filter
{
"execute_price": "ticker()",
"execute_volume": "100",
"buy_orders_count": "1 if (rsi(candles('m1'))[0] < 30 and ema(candles('m1'), 9)[0] > ema(candles('m1'), 21)[0]) else 0",
"sell_orders_count": "0"
}
This logic executes a buy order only if both of the following conditions are met:
- The RSI (Relative Strength Index) on the 1-minute timeframe is below 30, indicating a potential oversold condition.
- The 9-period EMA is above the 21-period EMA, suggesting the market is trending upward.
This compact logic ensures that trades are triggered only when the asset is oversold and the broader trend is supportive, improving signal reliability.
Alternatively, you can split this logic into modular grids to enhance transparency and reusability:
- Grid 1 – RSI Signal
Detects oversold conditions (e.g. RSI < 30) - Grid 2 – EMA Trend Filter
Confirms bullish momentum (e.g. EMA(9) > EMA(21)) - Grid 3 – Entry Timing
Adds an optional refinement (e.g. Stochastic confirms reversal) - Grid 4 – Exit Strategy
Defines trade closure logic (e.g. Bollinger Band breakout or rebound)
With Origami Tech, you can create an unlimited number of grids per bot, reuse logic across projects, and fine-tune every layer of decision-making using visual blocks or code.
Hybrid Bot Strategy Example
A full-featured bot might include:
- EMA crossover to validate the uptrend
- RSI to find oversold pullbacks within that trend
- The Stochastic Oscillator to sharpen entry timing
- Bollinger Bands to define price targets and manage exits
This layered architecture minimizes noise, adapts to market phases, and results in a more consistent and resilient trading system over time.
Conclusion
Choosing the right indicators is the foundation of every successful crypto bot trading strategy. The five essential technical indicators we covered, RSI, EMA, Bollinger Bands, Stochastic Oscillator %K, and KAMA, offer a blend of trend, momentum, and volatility analysis that will cover nearly every market condition.
When used together in Origami Tech’s no-code system, they enable you to build reliable, intelligent, and fully automated bots for both spot and crypto futures trading.
Next Steps:
- Explore indicator functions in Origami Tech’s documentation.
- Sign up at Origami Tech, create your first project, and connect your exchange account.
- Launch your first hybrid crypto trading bot today.
Ready to leverage automation in order to trade smarter? Origami Tech provides you with all the tools you need to do just that. Join Origami Tech today and get full control and better performance, without any of the hassle that comes with coding.
You may also like


Trade Smarter with Origami Tech
Take your crypto trading to the next level with our powerful automated trading terminal. Maximize profits, minimize risks, and stay ahead of the market 24/7.