

5 лучших технических индикаторов, которые должен использовать каждый криптоторговый бот
Introduction
In automated crypto trading, the efficiency of your strategy depends heavily on the technical indicators your bot uses. These indicators constitute the core of your decision-making logic, as they define when to buy, when to sell, and under what conditions.
A technical indicator is a mathematical formula that analyzes historical and real-time market data such as price, volume, or volatility. Unlike fundamental analysis, indicators don’t look at news or macroeconomics, they focus strictly on price behavior to generate actionable signals.
For example:
- RSI measures whether a token is overbought or oversold.
- EMA tracks the direction and strength of a trend.
- Bollinger Bands show volatility and help detect when a price deviates too far from its average.
With crypto trading bots, indicators act as signal triggers. They’re used in formulas and logic blocks that tell a bot exactly what to do and when.
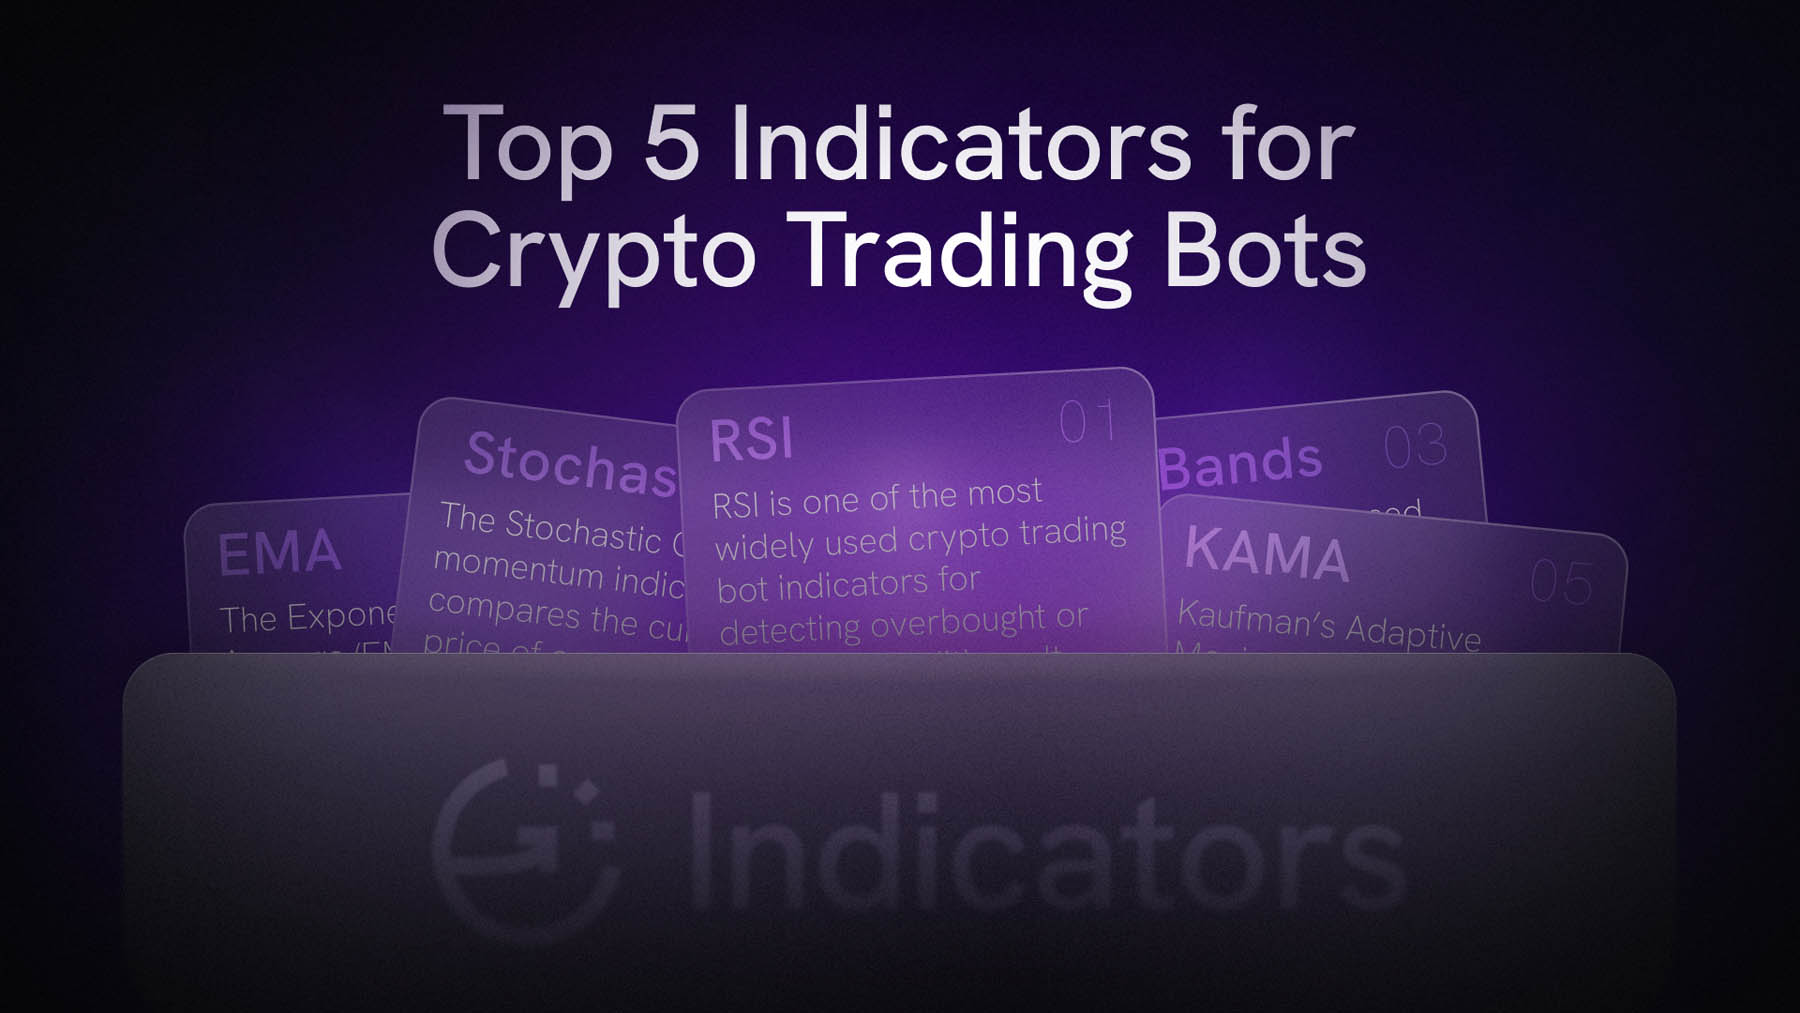
In this article, we’ll cover the 5 best crypto trading bot indicators. We’ve chosen them for their reliability, speed, and compatibility with Origami Tech, a no-code crypto trading bot platform used for building and managing automated strategies across spot and futures markets.
Criteria for Choosing Crypto Trading Bot Indicators
Before diving into specific indicators, it’s important to understand what makes an indicator “bot-worthy.” Here are the three key criteria:
1. Signal Reliability
The best crypto trading bot indicators should help your bot make smart decisions, not random guesses. Signal reliability refers to how often the indicator gives you a correct buy or sell signal. If it frequently tells the bot to trade during minor price fluctuations (“noise”) rather than during real trends, it creates false positives, or trades that lose money.
Reliable indicators filter out this noise. They only act when the market shows strong signs of movement. For example, instead of reacting to every price dip, a reliable RSI setup waits for a truly oversold signal before buying. This helps your bot avoid chasing meaningless price moves and reduces losses from unnecessary trades.
2. Computational Efficiency
Crypto bots run non-stop — analyzing markets, updating strategies, and placing orders 24/7. To be useful, your crypto trading bot indicators must be lightweight and fast. If a formula takes too long to calculate, especially in volatile markets, it could result in delayed decisions and missed opportunities.
3. Compatibility with Software
Origami Tech eliminates this concern by offering a robust library of built-in indicators, including RSI, EMA/SMA, Bollinger Bands, and many others commonly used in technical analysis. These indicators can be applied through an intuitive visual interface using simple formulas, variables, and conditional logic, without any programming. The platform supports seamless use of these tools across both spot and futures trading strategies, allowing users to build and customize sophisticated bots with ease.
4. Trading Use Cases
Not all indicators are designed for the same purpose. Some work better in trending markets, while others are best for sideways or volatile conditions. Choose indicators that match the type of trading you’re automating:
- Spot bots benefit from momentum and reversal indicators like RSI and Bollinger Bands, which help identify short-term price extremes.
- Futures bots often rely on trend-following tools like EMA, along with volatility triggers, to manage leverage and margin.
- Swing strategies (medium-term trades) usually combine multiple indicators. For example, they can employ EMA to define trend direction and RSI or the Stochastic Oscillator to time entries, helping confirm signals before executing a trade.
Top 5 Technical Indicators for Trading Bots
1. Relative Strength Index (RSI)
RSI is one of the most widely used crypto trading bot indicators for detecting overbought or oversold conditions. It measures market momentum by analyzing recent price changes, outputting a value from 0 to 100.
- Typical Use: Buy when RSI < 30 (oversold), sell when RSI > 70 (overbought).
- Origami Tech Deployment: Use rsi_to_price() in the grid formula to calculate entry prices directly based on RSI signals.
Sample Grid in Origami Tech:
execute_price = rsi_to_price(candles('m15', 'BTC-USDT', 'binance'), 30)
execute_volume = balance('counter').available * 0.05 / execute_price
buy_orders_count = 1
sell_orders_count = 0
This setup tells your crypto trading bot to buy BTC/USDT when the 15-minute RSI drops below 30, a powerful reversal signal in volatile markets.
Backtest Insights:
- Best for: Range-bound or mean-reverting markets.
- Warning: Avoid during strong trends, where RSI can remain in overbought/oversold zones for extended periods of time.
2. Exponential Moving Average (EMA)
The Exponential Moving Average (EMA) is a core trend-following indicator used in crypto bot trading. It smooths out price movements and gives more weight to recent data, allowing bots to detect market direction with minimal delay.
With Origami Tech, EMA is implemented through a built-in function that works directly with candle data:
ema(candles: List[[Candle]], period: int = 14, column: str = "close") -> List[Decimal]
This function calculates a series of EMA values over any timeframe using the selected candle source (e.g., 1m, 5m, 15m) and the specified price type, which is typically the closing price. The default period is 14, but you can adjust it to fit your strategy.
EMA is often used in bots to:
- confirm trend direction before entering a trade;
- avoid signals that go against market momentum;
- support logic for entries, exits, or position scaling.
3. Bollinger Bands
Bollinger Bands are used in crypto bot trading to detect periods of high and low volatility, as well as potential overbought or oversold conditions. The indicator consists of three lines: a central moving average and two bands, upper and lower, placed at a distance defined by standard deviation.
In Origami Tech, Bollinger Bands are calculated with the following function:
bbands(candles: List[[Candle]], period: int = 20, multiplier: float = 2, column: str = "close") -> List[BBANDS]
This function returns a list of objects containing .upper, .middle, and .lower values based on the selected period and volatility settings. The bands dynamically adjust: they expand when volatility rises and contract when the market is calm.
Crypto trading bots in Origami Tech often use Bollinger Bands to:
- Detect volatility squeezes that may lead to breakouts;
- Identify oversold conditions near the lower band and overbought conditions near the upper band;
- Filter entries or exits during sideways markets.
Bollinger Bands are especially effective in mean-reversion strategies or when paired with momentum indicators like RSI. In Origami Tech’s no-code environment, you can directly use Bollinger values in your formulas without having to write any backend logic.
4. Stochastic Oscillator %K
The Stochastic Oscillator is a momentum indicator that compares the current closing price of an asset to its price range over a defined period. It helps crypto trading bots identify whether the market is in an overbought or oversold condition, making it especially useful for short-term reversal strategies.
In Origami Tech, the %K line of the Stochastic Oscillator is calculated using the following function:
stoch(candles: List[[Candle]], period: int = 14) -> List[Decimal]
Parameters:
- candles: list of historical candle data
- period: number of candles used to calculate the high-low range (default: 14)
Returns:
A list of %K values, the core of the stochastic calculation, showing the current close's position relative to the recent high-low range.
Traders typically interpret:
- Values above 80 as overbought (possible sell zones),
- Values below 20 as oversold (possible buy zones).
On Origami Tech, this function can be used inside grid formulas to build responsive entry logic or filter trades during sideways conditions. Stochastic %K is especially effective when paired with trend filters like EMA or Bollinger Bands.
5. Kaufman’s Adaptive Moving Average (KAMA)
Kaufman’s Adaptive Moving Average (KAMA) is a dynamic trend indicator that adjusts its sensitivity based on market volatility. Unlike standard moving averages, KAMA becomes smoother in sideways markets and reacts faster during strong trends, making it especially effective for crypto trading bots that need to filter out noise while staying responsive.
In Origami Tech, KAMA is calculated with the following function:
kama(candles: List[[Candle]], er: int = 10, fast: int = 2, slow: int = 30, period: int = 20, column: str = "close") -> List[Decimal]
Parameters:
- er: efficiency ratio period (default: 10)
- fast: fast EMA constant (default: 2)
- slow: slow EMA constant (default: 30)
- period: length of the smoothing window (default: 20)
- column: Тип цены, используемый для расчета (по умолчанию: "close")
KAMA можно использовать в формулах сеток Origami Tech для подтверждения силы тренда, отфильтровывания слабых сигналов или динамической корректировки логики позиций в зависимости от рыночных условий. Она особенно полезна в смешанных стратегиях, где рынок переходит между фазами консолидации и прорыва.
Объединение индикаторов в надежные стратегии
Истинная мощь автоматизации заключается в стратегиях, использующих несколько индикаторов. С помощью визуальной сеточной системы Origami Tech вы можете накладывать несколько условий, чтобы сделать вашего криптоторгового бота умнее и избирательнее.
Пример: RSI + EMA в качестве фильтра тренда
{
"execute_price": "ticker()",
"execute_volume": "100",
"buy_orders_count": "1 if (rsi(candles('m1'))[0] < 30 and ema(candles('m1'), 9)[0] > ema(candles('m1'), 21)[0]) else 0",
"sell_orders_count": "0"
}
Эта логика выполняет ордер на покупку только при соблюдении обоих следующих условий:
- RSI (индекс относительной силы) на 1-минутном таймфрейме ниже 30, что указывает на потенциальную перепроданность.
- 9-периодная EMA находится выше 21-периодной EMA, что указывает на восходящий тренд рынка.
Эта компактная логика гарантирует, что сделки запускаются только тогда, когда актив перепродан, а общий тренд благоприятен, что повышает надежность сигнала.
В качестве альтернативы вы можете разделить эту логику на модульные сетки для повышения прозрачности и возможности повторного использования:
- Сетка 1 – Сигнал RSI
Обнаруживает условия перепроданности (например, RSI < 30) - Сетка 2 – EMA в качестве фильтра тренда
Подтверждает бычий импульс (например, EMA(9) > EMA(21)) - Сетка 3 – Время входа
Добавляет необязательное уточнение (например, стохастик подтверждает разворот) - Сетка 4 – Стратегия выхода
Определяет логику закрытия сделки (например, прорыв или отскок от полос Боллинджера)
С Origami Tech вы можете создавать неограниченное количество сеток для каждого бота, повторно использовать логику в разных проектах и точно настраивать каждый уровень принятия решений с помощью визуальных блоков или кода.
Пример гибридной стратегии бота
Полнофункциональный бот может включать:
- Пересечение EMA для подтверждения восходящего тренда
- RSI для поиска перепроданных откатов в рамках этого тренда
- Стохастический осциллятор для уточнения времени входа
- Полосы Боллинджера для определения ценовых целей и управления выходами
Эта многоуровневая архитектура минимизирует шум, адаптируется к рыночным фазам и со временем приводит к более последовательной и устойчивой торговой системе.
Заключение
Выбор правильных индикаторов — основа любой успешной стратегии торговли криптоботами. Пять основных технических индикаторов, которые мы рассмотрели — RSI, EMA, полосы Боллинджера, стохастический осциллятор %K и KAMA — предлагают сочетание анализа тренда, импульса и волатильности, которое охватывает практически любые рыночные условия.
При совместном использовании в системе без кода Origami Tech они позволяют создавать надежных, интеллектуальных и полностью автоматизированных ботов как для спотовой, так и для фьючерсной торговли криптовалютами.
Следующие шаги:
- Изучите функции индикаторов в документации Origami Tech.
- Зарегистрируйтесь в Origami Tech, создайте свой первый проект и подключите свой биржевой аккаунт.
- Запустите своего первого гибридного криптоторгового бота уже сегодня.
Готовы использовать автоматизацию для более умной торговли? Origami Tech предоставляет вам все необходимые инструменты для этого. Присоединяйтесь к Origami Tech сегодня и получите полный контроль и лучшую производительность без каких-либо сложностей, связанных с кодированием.
Вам может понравиться


Автоматизируйте трейдинг с Origami Tech
Выведите трейдинг криптовалютой на новый уровень с помощью ботов Origami Tech. Увеличьте прибыль, минимизируйте риски и будьте впереди рынка в режиме 24/7.